News
Concerns Mount as South Africa’s Non-Revenue Water Surges to Alarming Levels

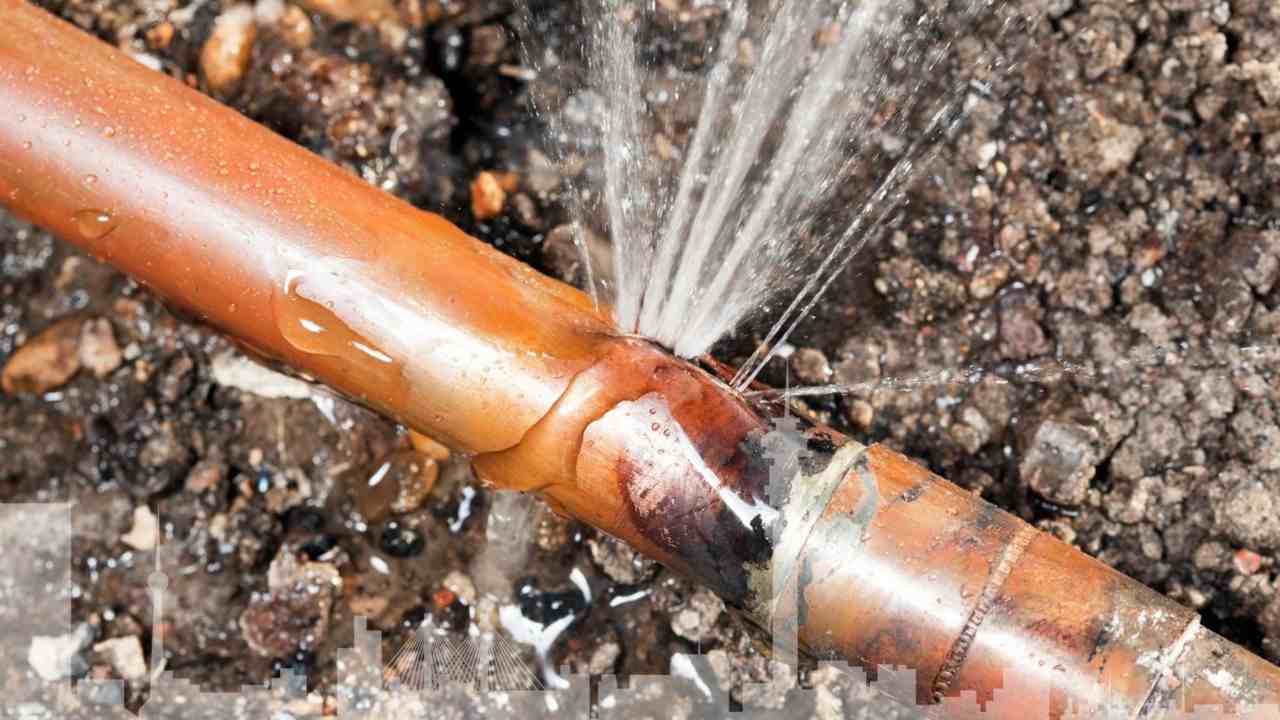
South Africa is grappling with a concerning surge in nonrevenue water (NRW), where almost half of the water transported through the country’s infrastructure disappears due to leaks, theft, or nonpayment.
However, technology could prove pivotal in curbing this escalating NRW problem, which has risen substantially since the Department of Water and Sanitation’s (DWS) last “No Drop” report in 2015.
According to Engineering News, the latest “No Drop Watch” report has revealed that NRW has climbed from 35% in 2015 to 46.4% in June 2022, significantly exceeding the global average of under 30%. Concurrently, water losses are at 40.7%.
This data equates to a staggering 1,988.50 million cubic meters of annual NRW, representing water municipalities cannot bill for. Water losses, including apparent and actual losses, amount to 1,744.7 million cubic meters annually.
This voluminous NRW constitutes nearly half of the preliminary 2021/22 national system input value (SIV), which denotes the water treated for municipal use, totalling 4,282.5 million cubic meters per year.
Over the past decade, NRW and water losses have shown consistent upward trends, with the most marked escalation occurring in the last three years. This surge is due to the impact of the COVID-19 pandemic, which led to increased supply, declining municipalities, reduced payment levels, budget cuts, and limited municipal capacity for repairs.
Water and Sanitation Minister Senzo Mchunu identifies the primary drivers behind the water losses as infrastructure failures, reservoir overflows, and leakages within municipal distribution systems.
Also read: Waterdal’s Water Woes: Farmers’ Struggles
Further factors include inefficiencies in leak and burst pipe repairs, vandalism, the non-implementation of water efficiency solutions, and unplanned settlements leading to unmetered water consumption.
The Infrastructure Leakage Index (ILI) has consistently deteriorated from 2016 to 2022, peaking at 6.4, indicating poorly managed physical losses. High physical losses within municipal distribution systems also contribute to South Africa’s above-average per capita consumption of around 216 litres per day, surpassing the estimated global average of 173 litres per day.
The report highlights that NRW exceeds the national average in seven of South Africa’s nine provinces.
While accounting for the highest SIV and per capita consumption, Gauteng registers an NRW percentage of 41.9%, lower than all provinces except the Western Cape.
The Western Cape, boasting an NRW of 29.6% and an SIV of 302.94 million cubic meters per year, emerges as the best-performing region regarding the lowest percentage of NRW, per capita consumption, and Infrastructure Leakage Index.
Limpopo and the Northern Cape record the highest NRW, at 56.7% and 56.2%, respectively, while KwaZulu-Natal showcases the highest ILI.
As many municipalities spiral into poor and declining water services, mounting debts, and reduced investment, the challenges persist, underscoring the need for multi-faceted collaboration among government, private sector, communities, and civil society to address this complex issue.
Also read:
Picture: X / TPRCSA
Follow us on Google News.


